The somatotype experiment
In 2019 I built the first version of what became Afitpilot. It was a static website with a single working tool — a somatotype calculator — written in vanilla JavaScript and rendered with Bootstrap.
https://walter-clayton.github.io/somatotype
The product idea wasn’t training plans yet. It was somatotypes.
The reference point was the 16 Personalities test. The idea was the same kind of typology, but for body composition rather than personality. The Heath-Carter somatotype method describes any human physique as a three-number rating across endomorphy (relative fatness), mesomorphy (relative musculoskeletal robustness), and ectomorphy (relative linearity). A 2-7-1 is a heavyweight wrestler. A 1-3-7 is an endurance runner. Most people are somewhere in the middle.
The method has a longer history than the name suggests, and parts of it are Belgian. Adolphe Quetelet, the 19th-century Belgian mathematician, was the first to quantify physique statistically — he coined what we now call BMI. In 1940, William Sheldon published The Varieties of Human Physique and introduced the term “somatotype,” recognising that everyone is a mixture of three components rather than a single type. Sheldon’s method was photographic and rater-dependent, and he claimed without support that somatotype correlated with personality and behaviour. Barbara Honeyman Heath and J.E. Lindsay Carter revised it in 1967 — replacing photographic rating with anthropometric measurement, removing the artificial 7-point ceiling on each component, and dropping the personality claims. The version still used in sports science today rests on 10 measurements: height, weight, four skinfolds, two bone breadths, and two limb girths.
Carter’s classification has 13 categories — Balanced Mesomorph, Endomorphic Mesomorph, Mesomorph-Ectomorph, Central, and so on — though the underlying space is continuous.
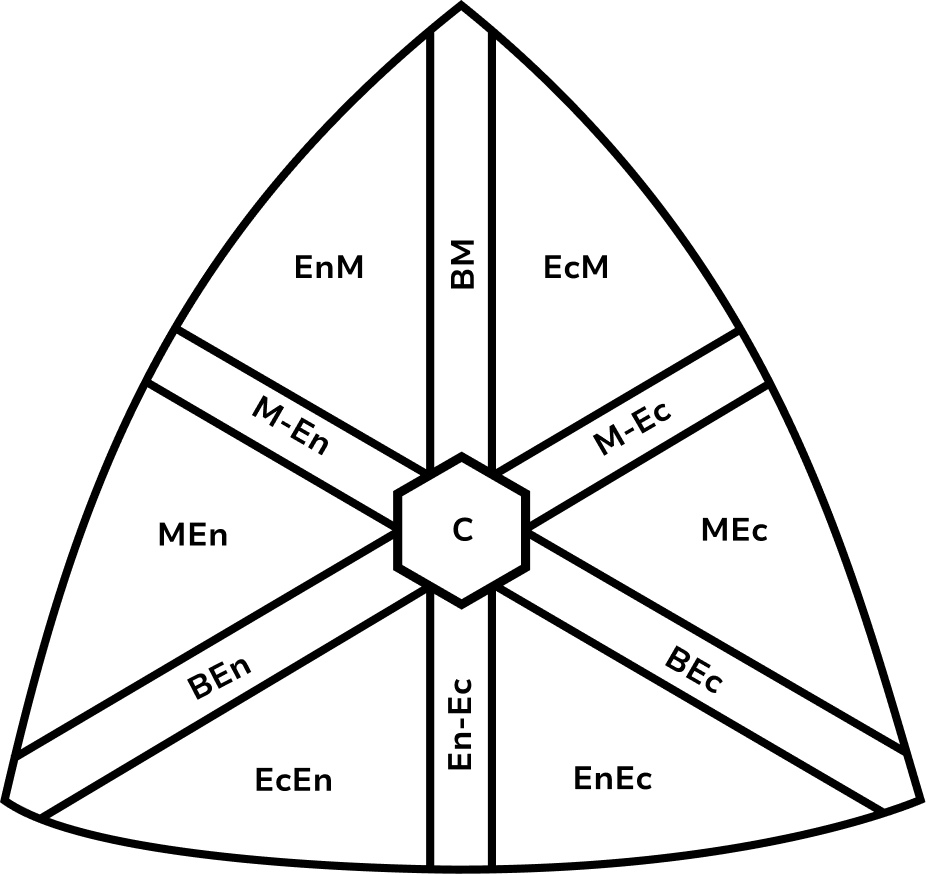
The calculator implemented the Heath-Carter equations directly from Carter’s 2002 instruction manual: a cubic polynomial for endomorphy, a linear equation for mesomorphy, and a piecewise function for ectomorphy based on the height-weight ratio with branches at 38.25 and 40.75. The equations themselves are well-defined. The work was in rendering the somatochart — a triangular plane onto which any three-number rating projects as a single 2D point — on an HTML canvas, which meant working out the projection geometry, the centroid, and a scaling factor.
The output was rough but the equations and the chart were correct.
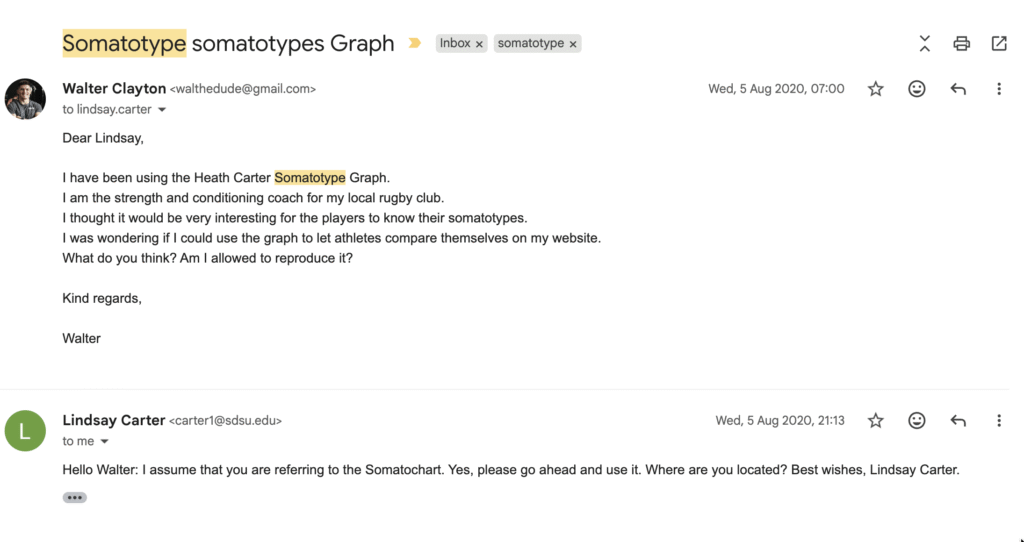

In August 2020 I emailed Lindsay Carter directly to ask if I could use the somatochart on my coaching website — I was working as the strength and conditioning coach for a local rugby club at the time, and wanted players to be able to compare themselves on the chart. He replied the same day: “Yes, please go ahead and use it.” He also asked where I was based, so I wrote back to tell him: Brussels.
The Afitpilot logo today is the same somatochart, redrawn in Figma and simplified into a brand mark. I wrote about that separately — [link to logo post].
The 2022 rebuild
Two years later I brought on three developers from my old bootcamp and rebuilt the somatotype tool as a full application — React on the frontend, Node.js and Express on the backend, MongoDB, Material UI. One developer worked on the marketing site, one on the app frontend, one on the backend and API. I handled architecture, research, UX, the design system, content, and project management. We tracked tickets in Google Sheets piped to Looker Studio. The plan was two months.
https://afitpilot-somatotype.vercel.app
The first plan was to skip manual measurement entirely by scanning the user’s body in 3D and extracting the dimensions automatically.
The 3D body scan
Heath-Carter measurement requires skinfold calipers, bone breadth measurements, and a trained anthropometrist. Skinfolds are technique-dependent — even experienced practitioners disagree at the same site by 2-3 mm, which is enough to shift a rating by a full point.
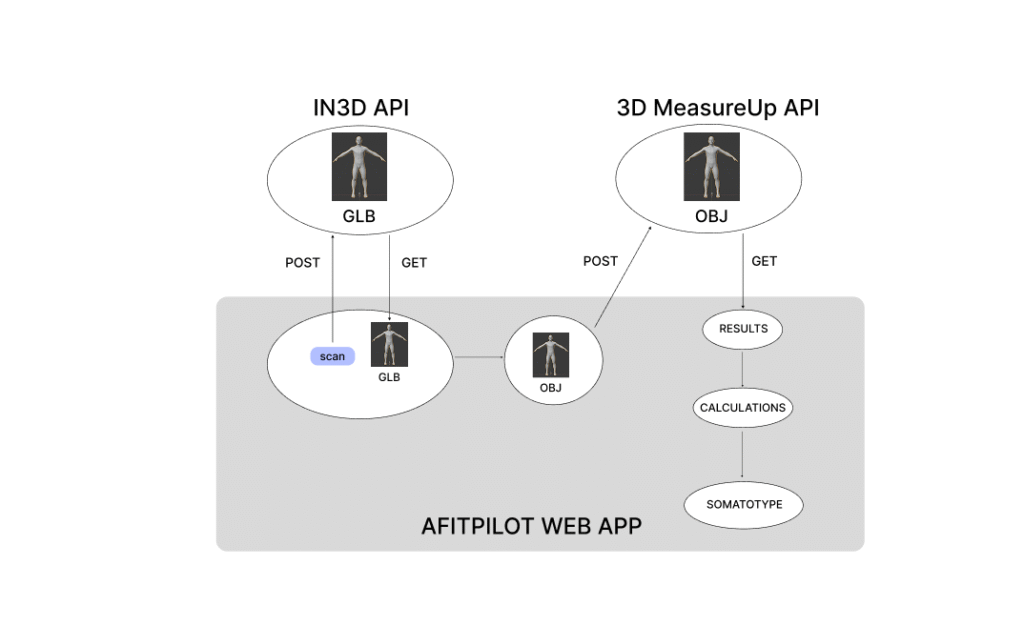
The pipeline used two APIs. The in3D API generated a full-body 3D model from a smartphone scan, returning a GLB file. I wrote a custom OBJExporter class — a Three.js-based parser that walked the mesh, line, and point geometry of the scan — to convert the GLB into OBJ format. The 3D MeasureUp API then extracted anthropometric data from the OBJ: height, body volume, biceps girth, calf girth.
That gave four direct measurements. The Heath-Carter equations need more, and several of the inputs — skinfold thicknesses, bone breadths — can’t be measured from an external scan. I derived the rest using predictive equations from forensic osteometry and clinical anthropometry:
- Body density from body mass and body volume (Rani et al., 2021)
- Femur breadth from height (Quintero Monterrosa et al., 2022) — the same family of regressions Trotter and Gleser established in their 1952 work on stature estimation from long bones
- Humerus breadth from femur breadth, with a fixed offset of approximately 2 cm (Mukhopadhyay et al., 2010)
- Body fat percentage from BMI and age via the Sloan equation (Naz et al., 2017)
- Skinfold sum from body density via the Carter density-to-skinfold conversion (Carter, 2002)
Two adjustments. The Heath-Carter mesomorphy equation expects flexed-arm girth, but 3D scans capture the arm relaxed, which underestimates by roughly 10 mm, so I added a correction. The humerus-to-femur breadth relationship was a fixed offset rather than a regression, because the population data on that ratio is thinner than the long-bone-from-stature literature.
The methodology doc flagged the humerus breadth and flexed arm circumference estimations as needing further validation. Error bars on a scan-derived somatotype were wider than on a properly measured one.
The pipeline worked end-to-end. It took more than five minutes per user to run.
There was a parallel problem with avatars. The original plan was to render each user’s actual scan as a Three.js avatar in the browser. The in3D models came back at over 300 MB each. Neither the latency nor the asset size was viable.
We went back to step-by-step manual measurement as the primary input flow, but kept the predictive equations as helpers — letting users skip fields they couldn’t measure and inferring the missing values from what they had entered. The avatars switched from rendered 3D scans to hand-designed SVGs: I drew one for each of the 13 categories in Affinity Publisher and Figma, and the user was matched to whichever category their rating fell into.
The application shipped at the end of the two months. Users signed up, walked through the measurement flow, got a somatotype rating, and saw their matched avatar plotted on the somatochart.
The 3D scan methodology stayed in a methodology doc. The predictive equations stayed in the codebase as fallbacks. The somatochart became the logo.